The biggest return is clarity. Now we actually have clarity on what we’re doing, I can take the strategic role of properly growing our business using data.
Synergist's built-in dashboards give agency leaders, finance directors, and ops teams an instant view of the numbers that matter. Management, sales, performance, and capacity dashboards each pull from live data, so there's one source of truth across the business.
Synergist tracks the financial health of every project and client in real time, showing estimated vs actual time and costs, profit margins, and potential overruns. Email alerts flag issues automatically so project leads can act before margin is lost.
Rooster Punk, a B2B marketing agency, uses Synergist's dashboards and reports to make data-driven decisions across the business.
The biggest return is clarity. Now we actually have clarity on what we’re doing, I can take the strategic role of properly growing our business using data.
Spreadsheets can show you what happened last month. A standalone BI tool can visualise data. But both rely on someone manually pulling numbers from your project management system, your timesheets, and your finance software. By the time the report is built, the data is already old.
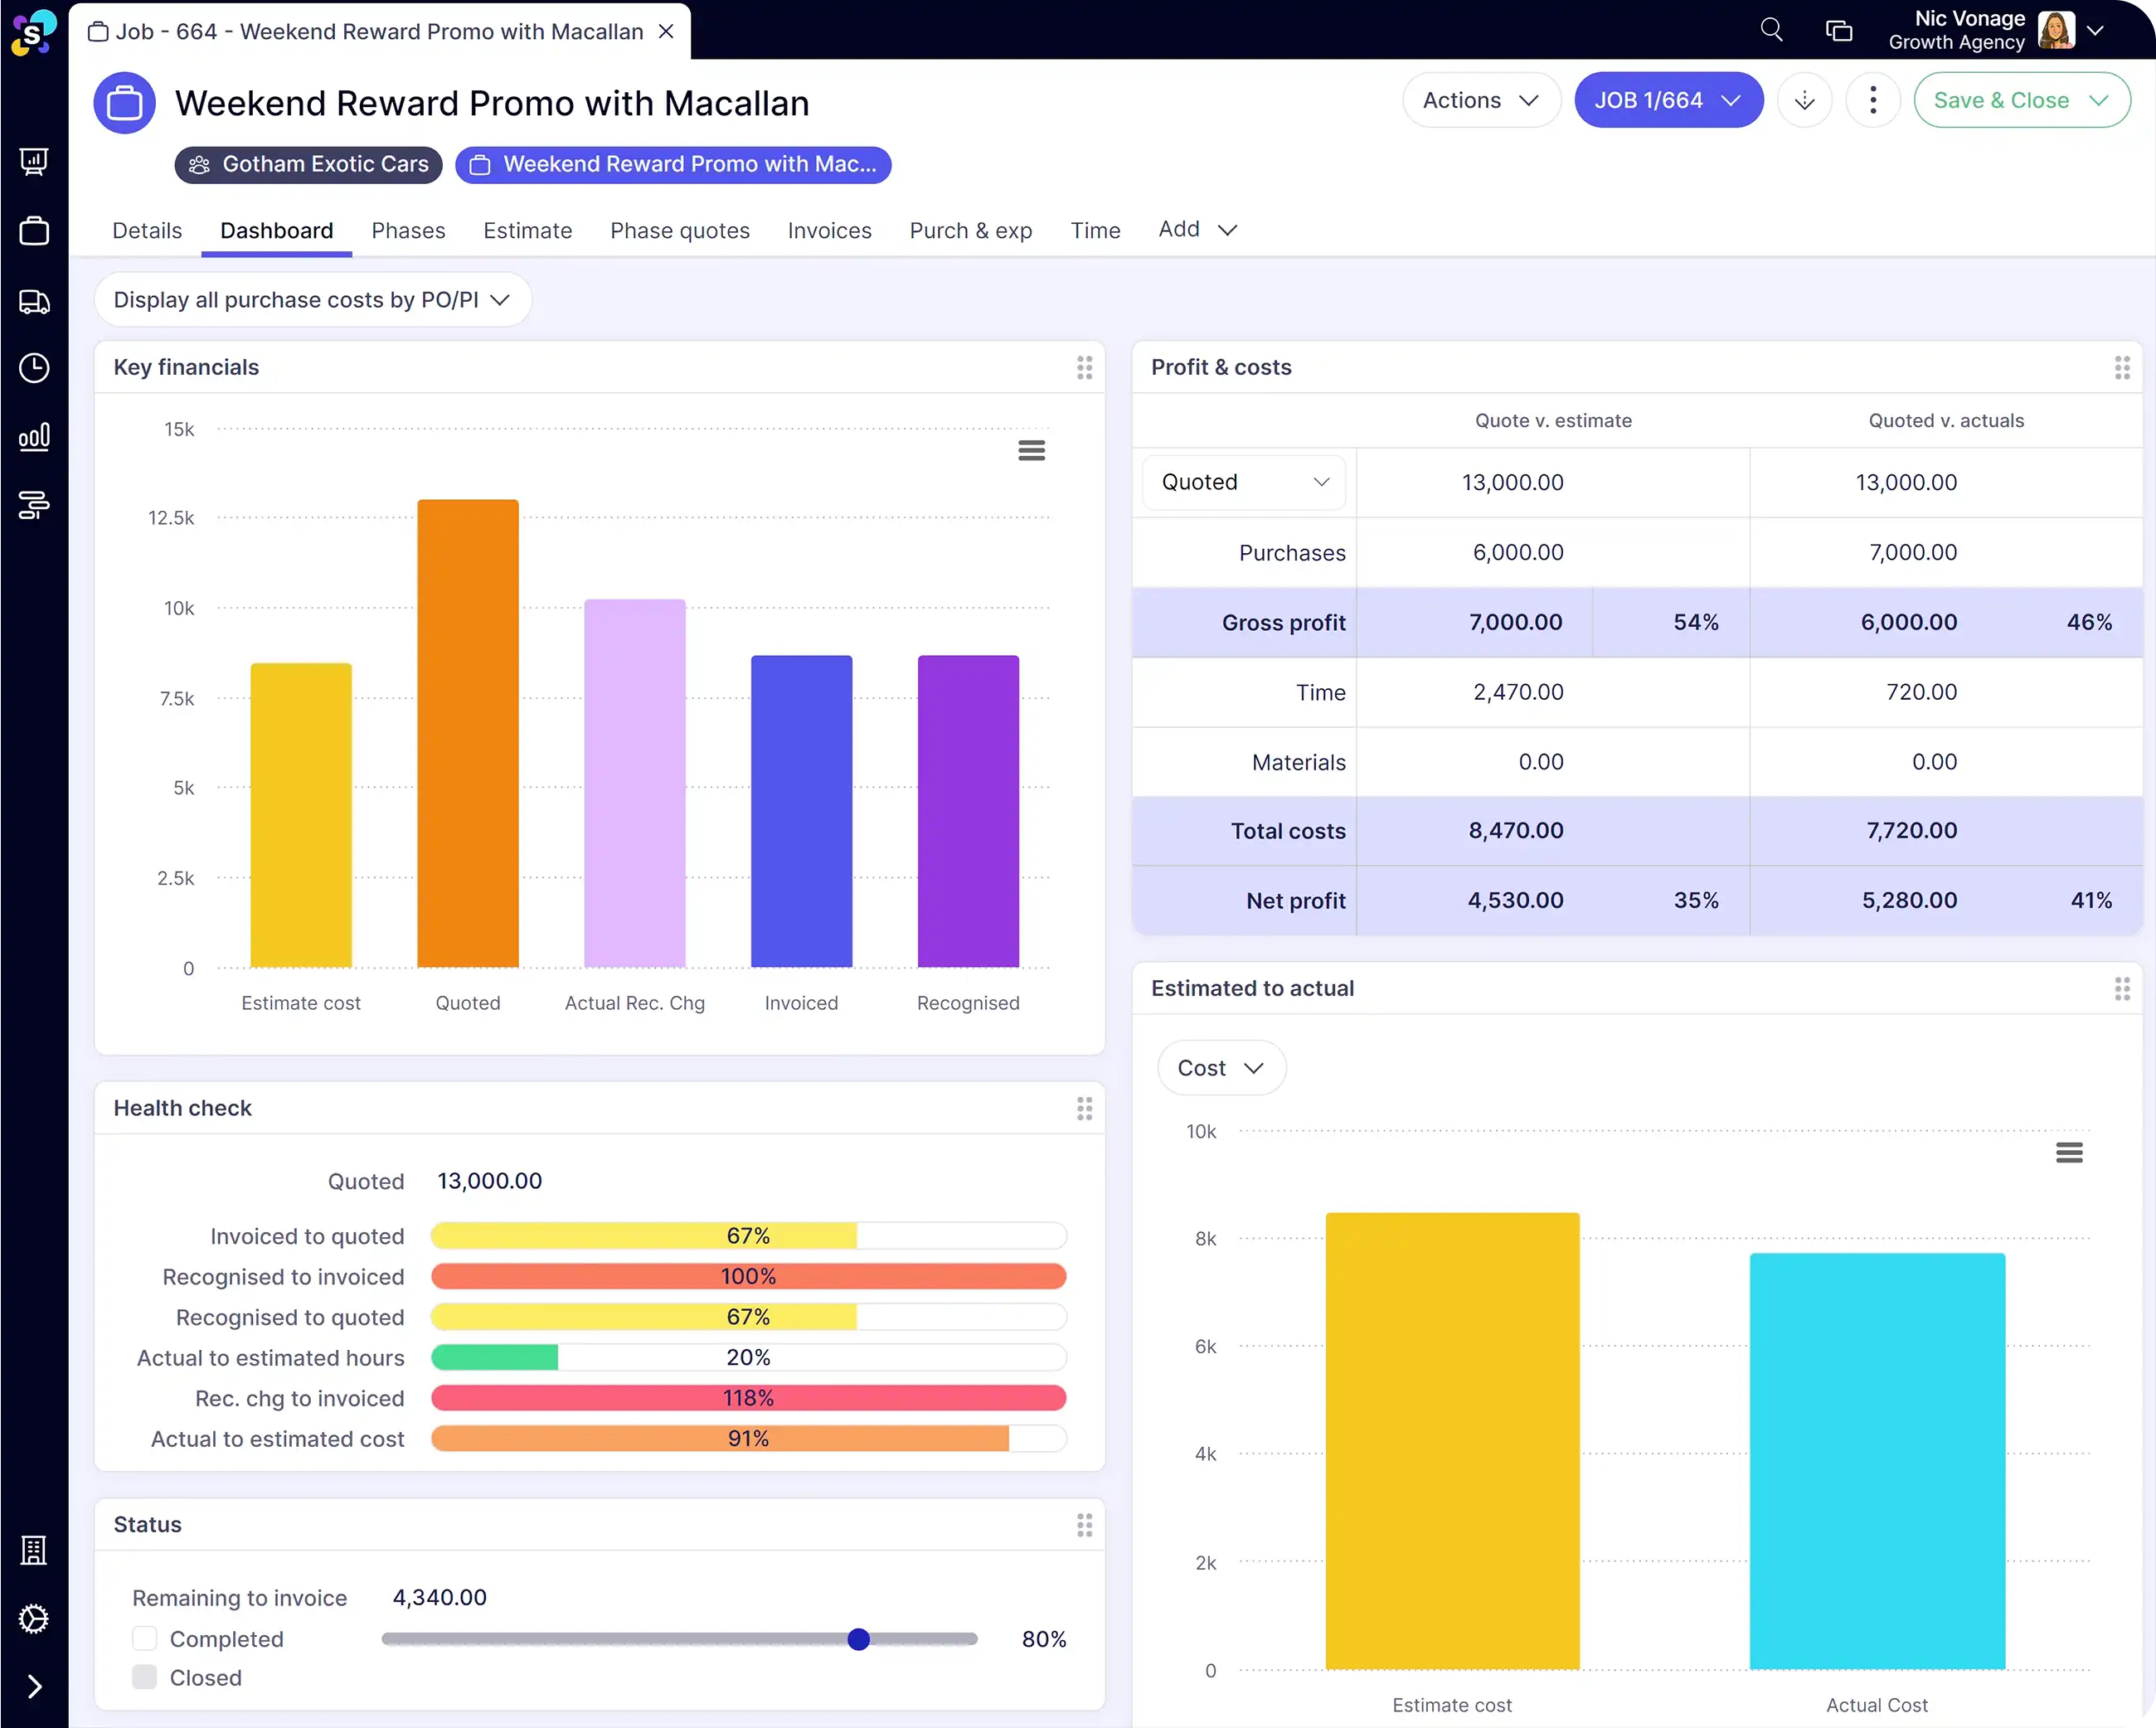
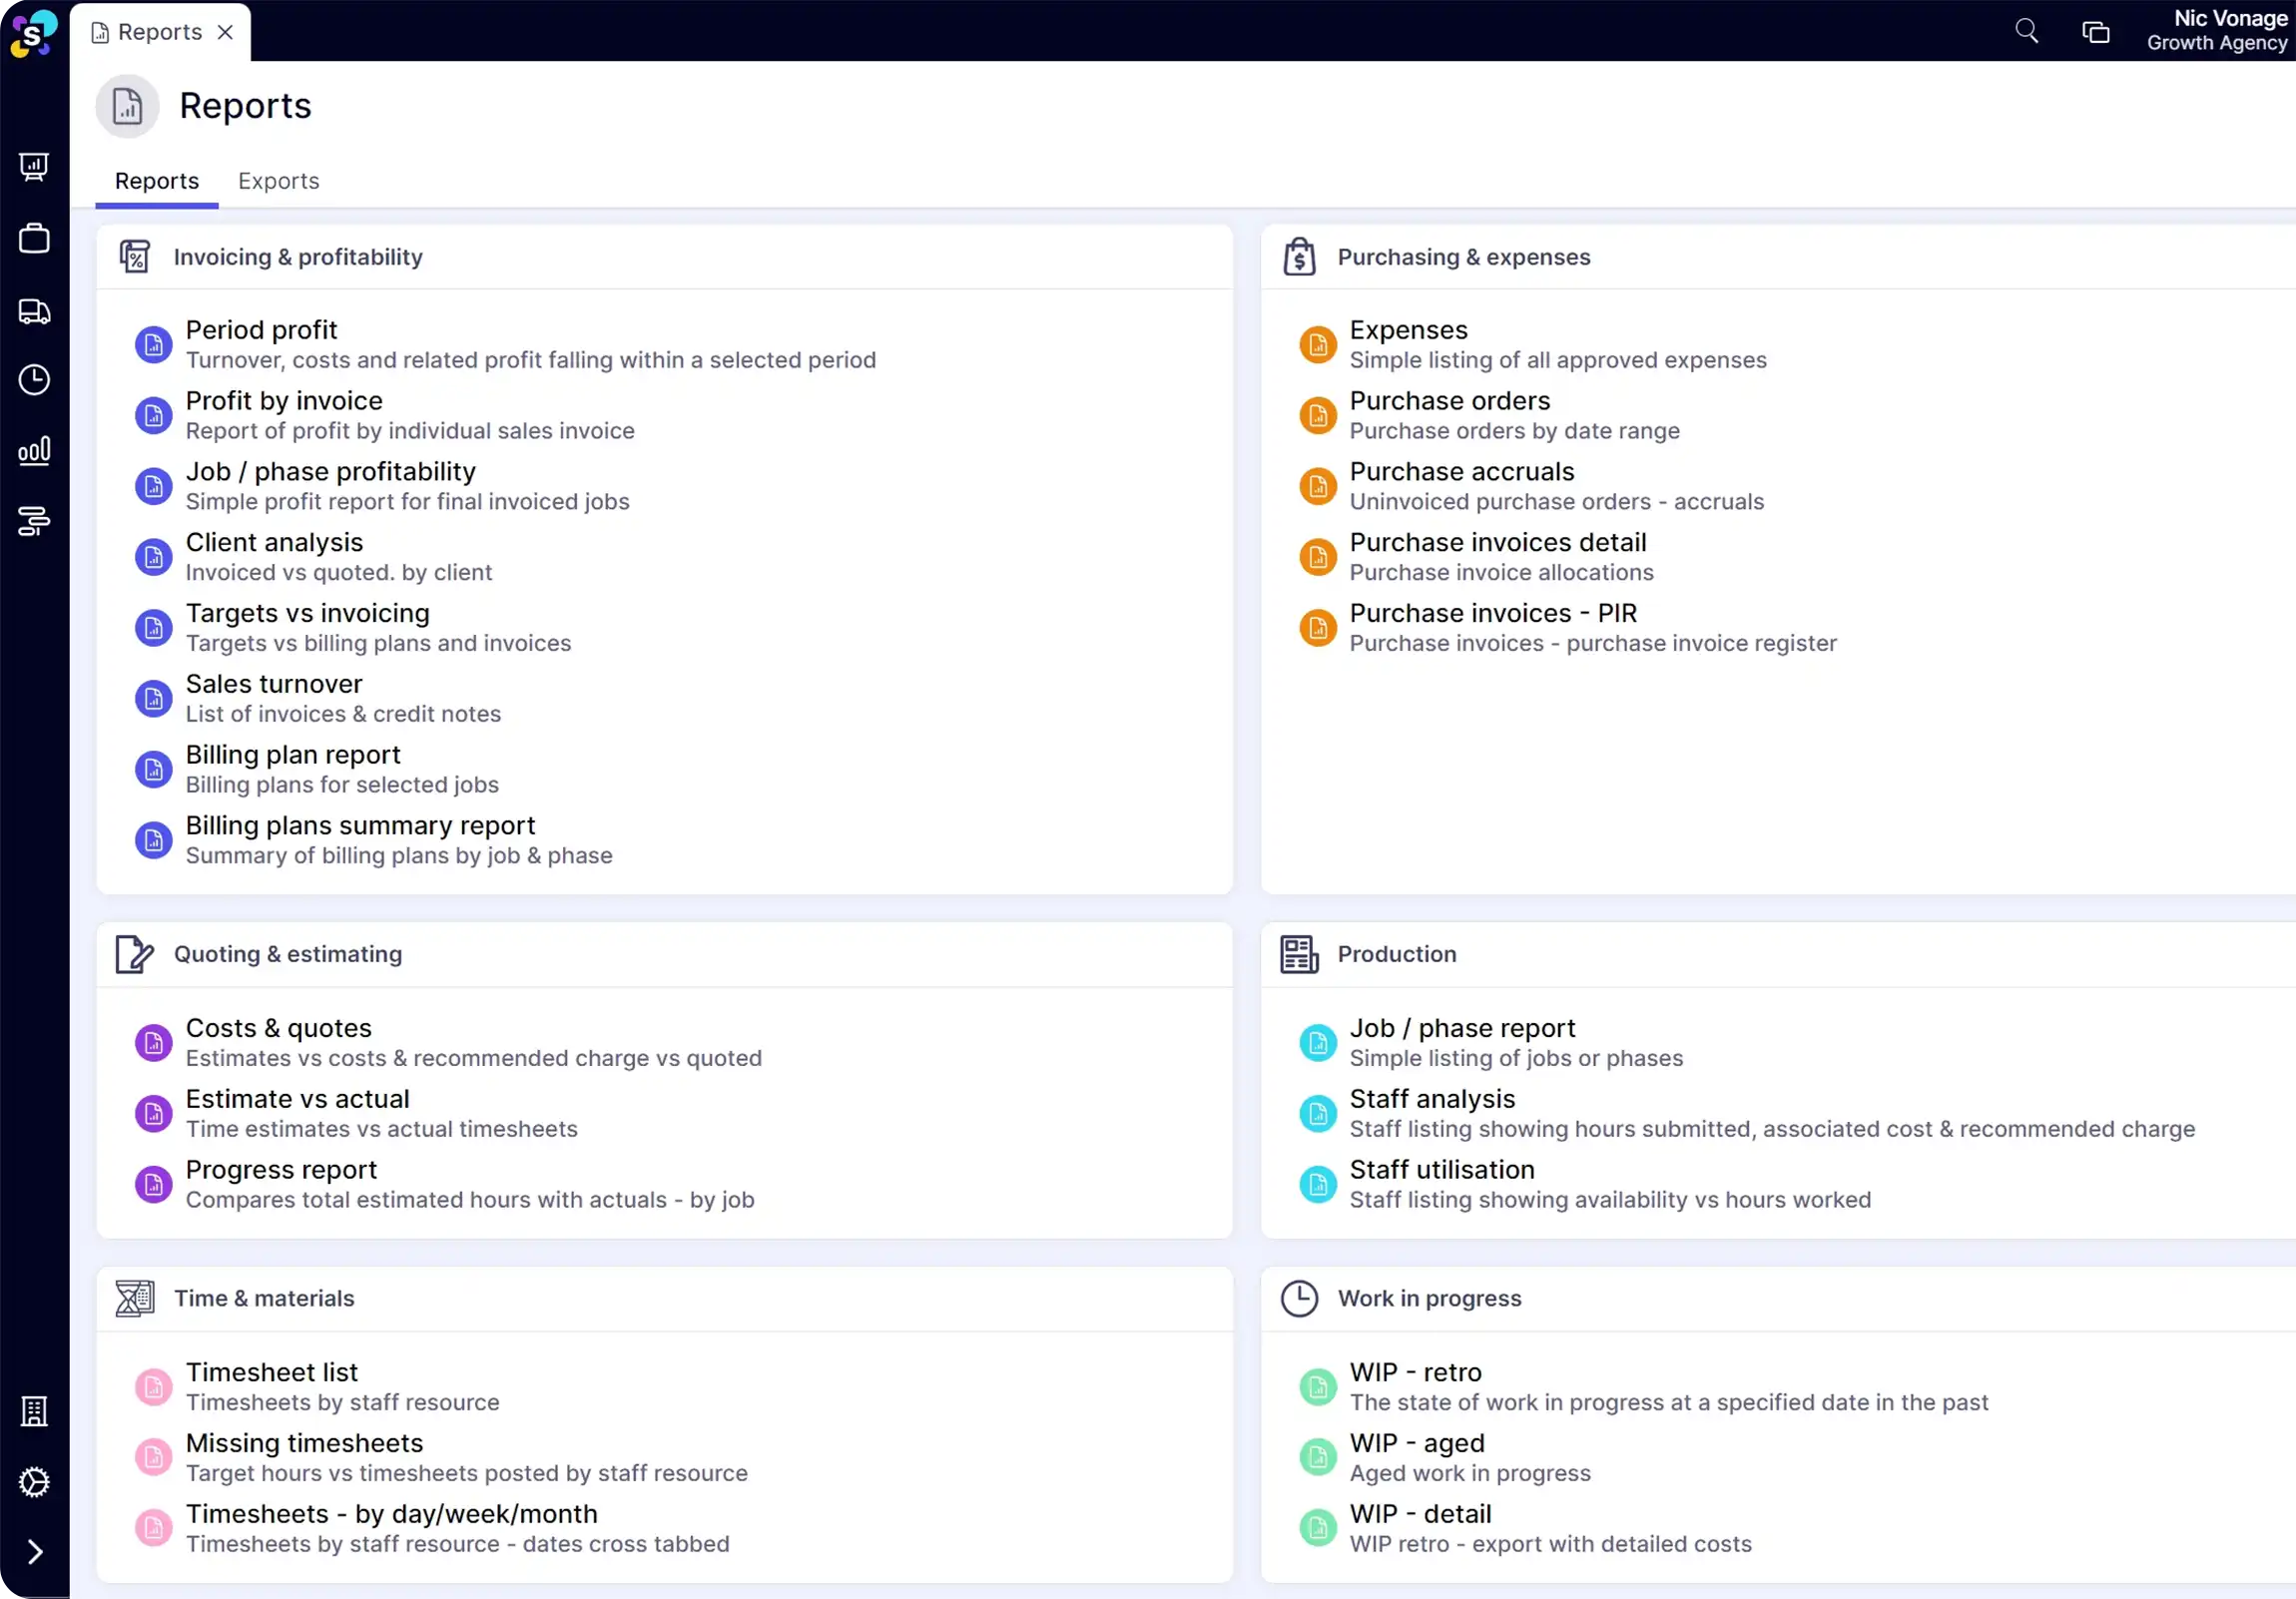
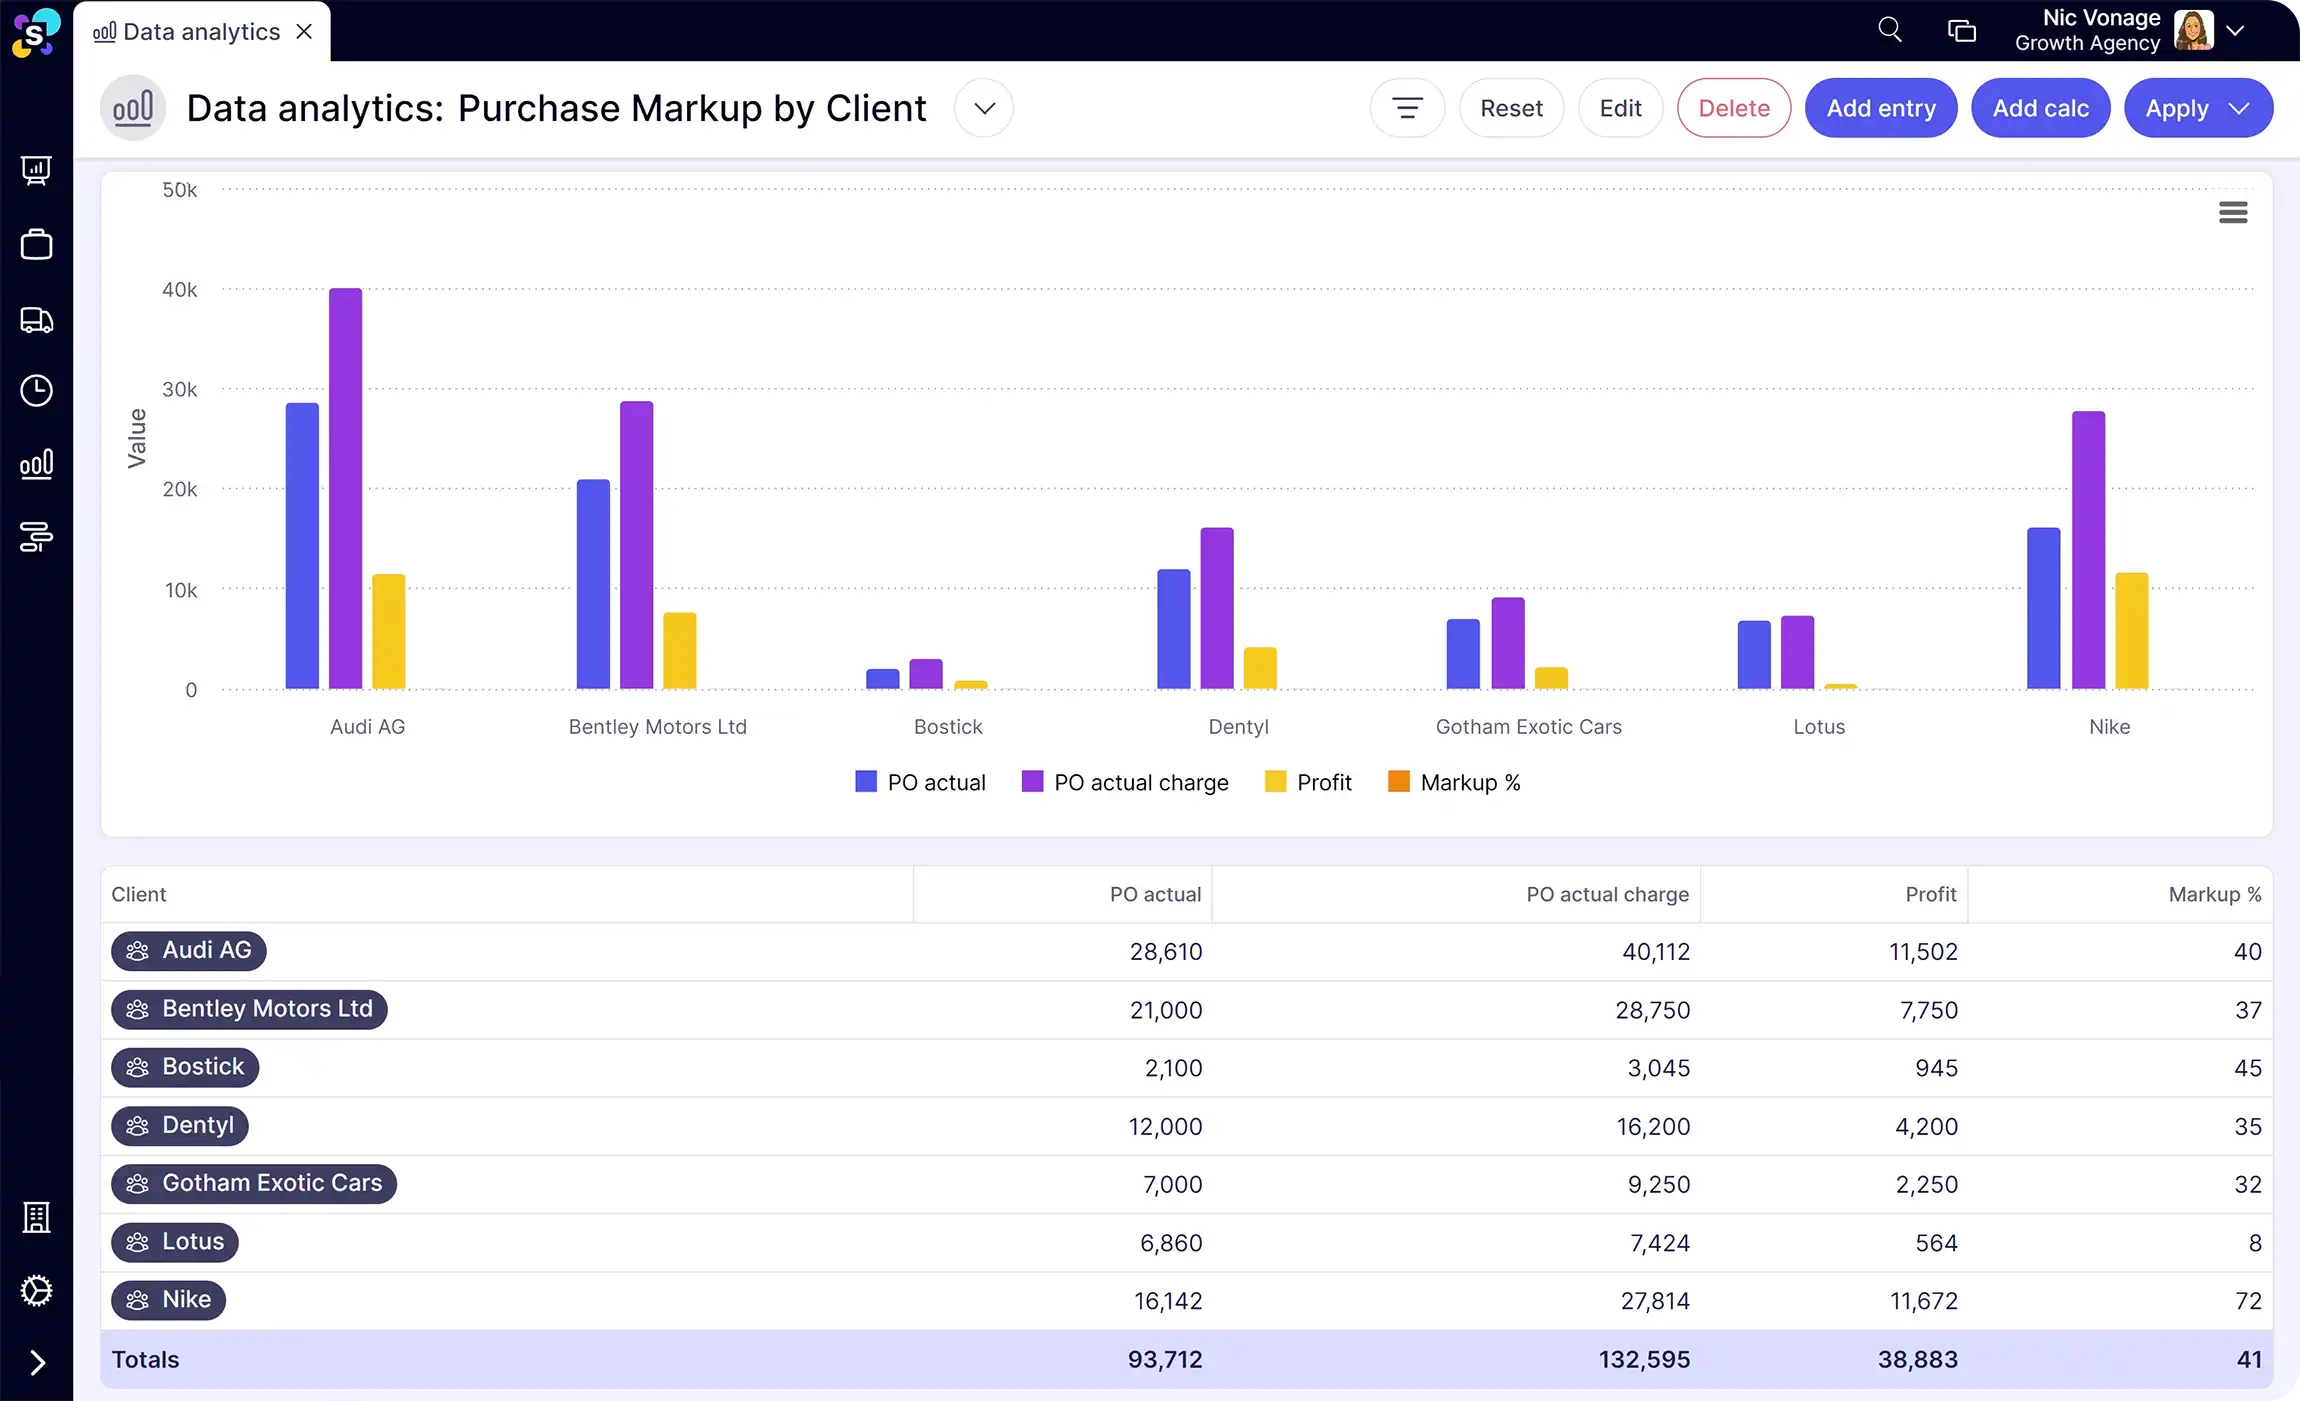
Synergist's dashboards and reports pull from live project data. When time is logged, a cost comes in, or an invoice is raised, the numbers update. That means agency leaders, finance directors, and project managers are all looking at the same data, in real time, without anyone having to build a spreadsheet first.
Want a deeper look? Watch our product tour to see how agencies manage reporting and dashboards with Synergist
Synergist delivers a suite of detailed reports covering revenue, work in progress, profitability, utilisation, and costs at the business, client, or project level. Reports can be scheduled to arrive automatically via email, so the right people always have the data they need.
Synergist's data analytics tool lets you build bespoke reports using custom filters, date ranges, columns, and cross-tabs. Save them to your analytics dashboard for quick access, share with teams, or schedule regular email delivery.
Synergist includes four core dashboards: a Management dashboard showing revenue, profit, and earnings per head; a Sales dashboard tracking pipeline and account handler performance; a Performance dashboard covering utilisation and time recovery; and a Capacity dashboard showing available, booked, and sold hours by team, skill, or individual.
Yes. Synergist's data analytics tool lets you build bespoke reports with custom filters, date ranges, columns, and cross-tabs. You can visualise data with charts and tables, save reports to your analytics dashboard, and schedule them to be emailed automatically to the right people.
Yes. Synergist's job dashboards show estimated vs actual time and costs, percentage completion, potential overrun, and profit margin for every project and phase. The data updates as time is logged and costs come in, so you always have a live view of how each job is performing.
Yes. Synergist lets you set up email alerts that fire when specific criteria are met, for example when a job reaches a set percentage of its budget or when costs are added to an already-invoiced project. This means issues are flagged automatically rather than waiting for a monthly report.
Have more questions? Drop us an email enquires@synergist.co.uk
Business analysis often skips the to-do list, especially when you're too busy working in your business (the fun stuff). But you could be missing out on a game-changer.